flowchart LR
    x(("x")) --> nature("nature") --> y(("y"))
1 Why study applied stats?
1.1 Statistics is everywhere
Statistics starts whenever you have
- a question about the world (or nature or life),
- data.
We’ll treat nature as a black box which associates an input variable \(x\) with an output variable \(y\):
Think of \(x\) and \(y\) as very long vectors (lists of numbers) that represent a particular state of the world (or the part you’re focusing on). In statistical terms, \(x\) is the predictor variable and \(y\) is the response variable.
There is the astonishingly wide range of applications, in terms of
- fields, e.g. biology, psychology, physics, (all experimental sciences, you name it!), business and politics (hopefully!),
- objectives,
- quality/quantity of data,
- etc.
As a result, it’s impossible to classify properly all statistics. Still, as in Breiman (2001), I like to categorize into two kinds of objectives:
- Prediction: given the predictor \(x\), what’s the response \(y\)?
- Information: understand the mechanisms that link the response to the input variables.
Statistics is a set of methodological and mathematical tools to reach both goals. This class will present tools to do both.
NoteIn-class activity
Consider the following questions, taken from academic journals
- how can you calm yourself after an adverse interaction? Kanaya and Kawai (2024)
- is is better for stress to be around nature? Chang et al. (2024)
- how does your attention evolve after a walk in the park? McDonnell and Strayer (2024)
Can you find the answer to those questions in the article text? Look at the “Results” section.
NoteIn-class activity
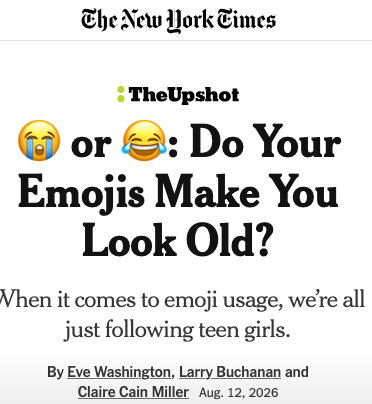
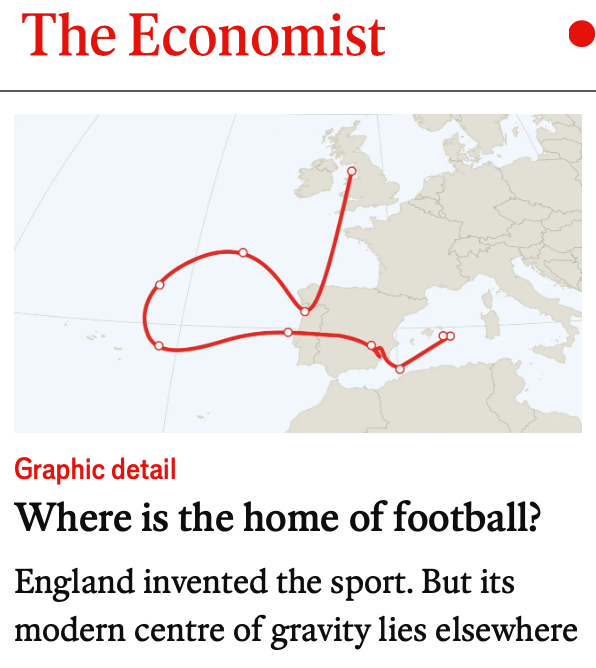
In Figure 1.1, six newspaper articles answer a simple question using a statistical approach.
- What would you answer off the top of your head?
- Do the articles confirm or infirm with your original opinions?
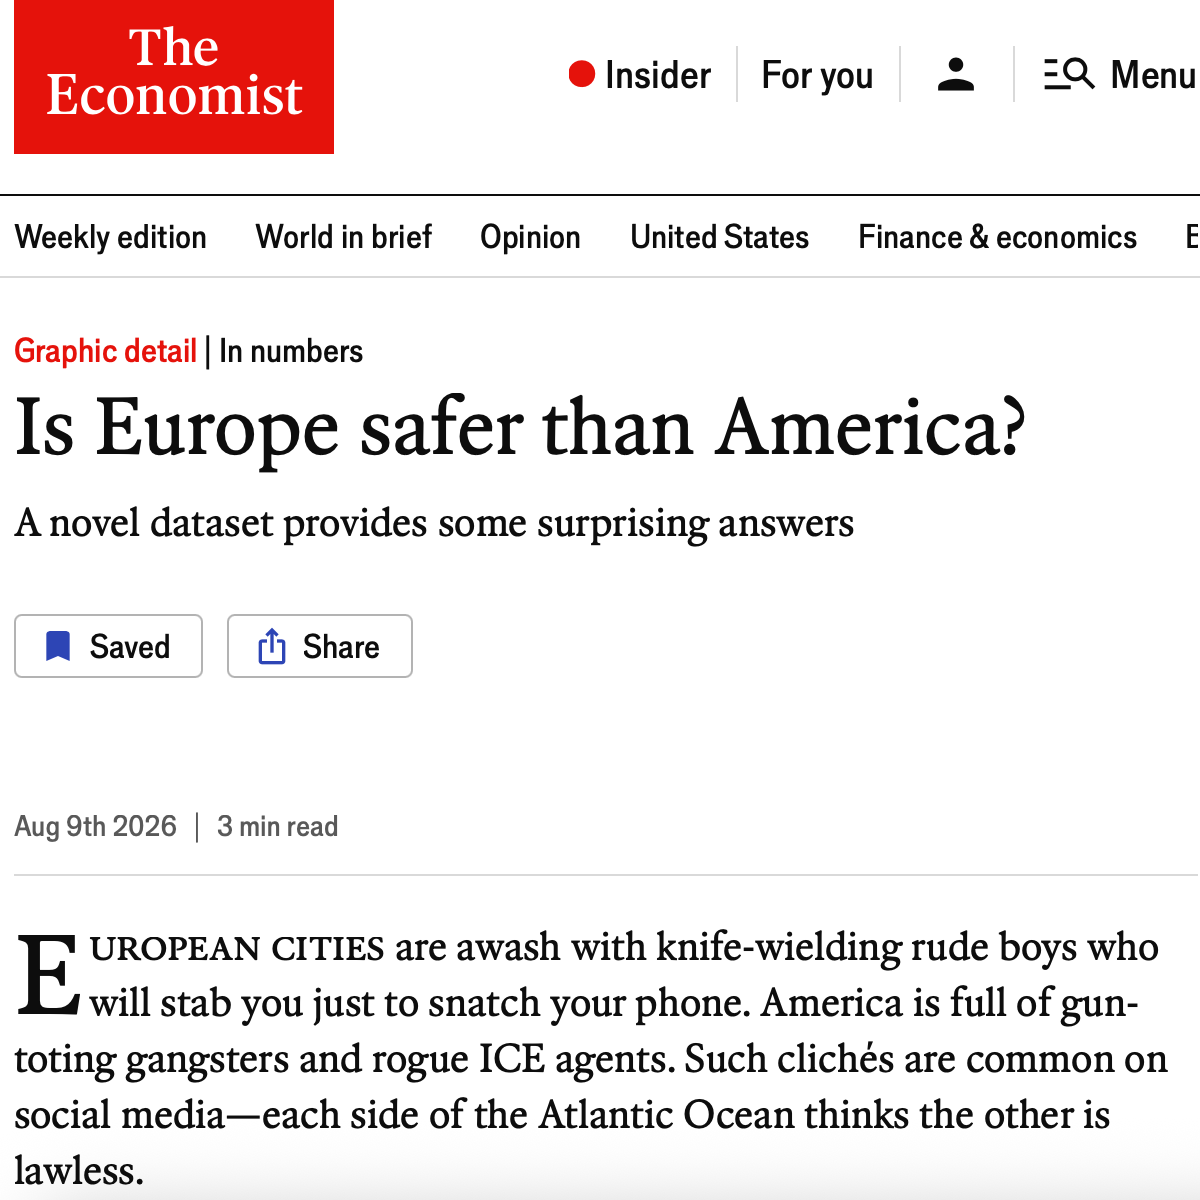
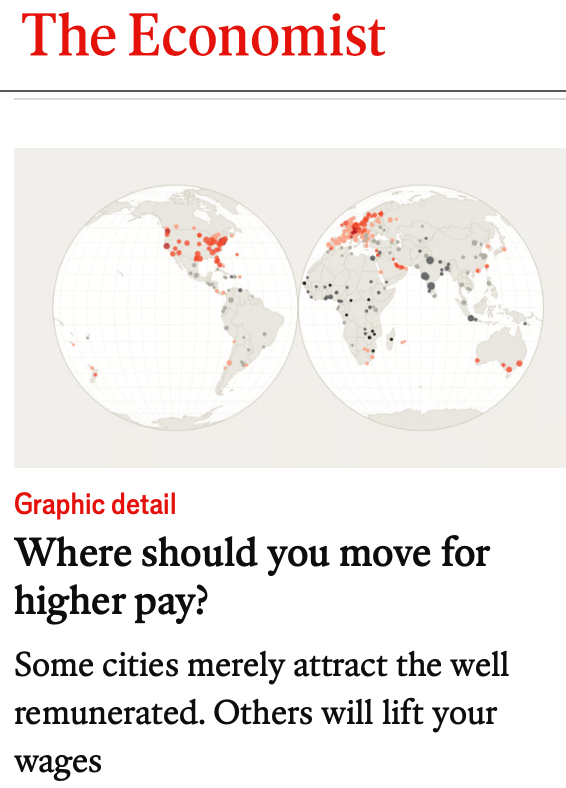
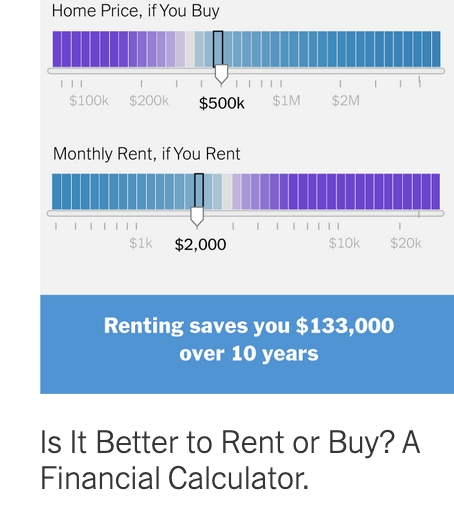
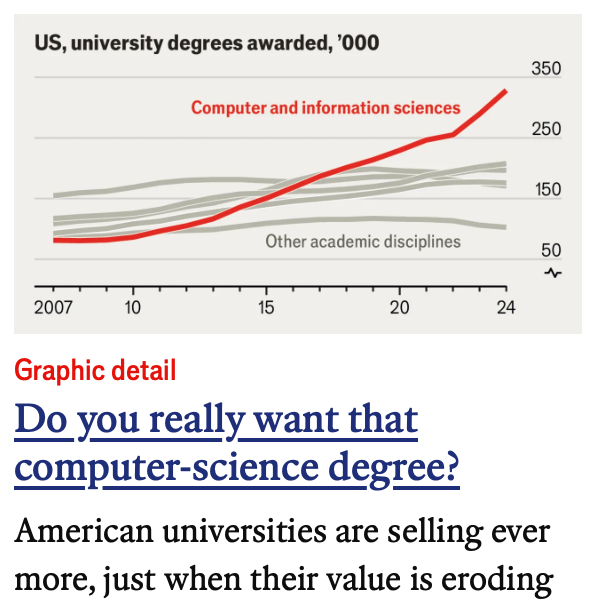
1.2 Statistics is complex technical and requires training
Although it tries to answer simple questions, statistics is not a collection of simple common-sense rules that can be deduced easily. It requires an education and practice.
One reason is that statistics are the result of more than a century of research and development across many different fields, for a wide range of purposes (not always of the most savoury kind), by people with varied backgrounds. Some of the tool names and modelling choices are natural; others are arbitrary, but are now standard. To communicate the conclusions of your future statistical studies effectively, it’s important to use the correct terms.
Another reason is that statistics use mathematical notions to be as rigorous as possible. Maths is a language and must be learned just like any other natural language.
NoteTerminology: a statistic vs. Statistics
A statistic is a numerical summary of data. Statistics (the field) is the set of techniques, methods, and procedures for data analysis and interpretation.
Examples of statistics: average, median, standard deviation, correlation, regression, hypothesis testing, confidence intervals, etc. For instance, from Foramitti et al. (2025):
For the analysis around the onset of COVID-19, the model explained 85.6% of the variance in lyrical compressibility (adjusted R² = 0.856). The interaction between time and period was small and not statistically significant (β = 0.001, 95% CI [−0.003, 0.005], t(49) = 0.623, p = .537).
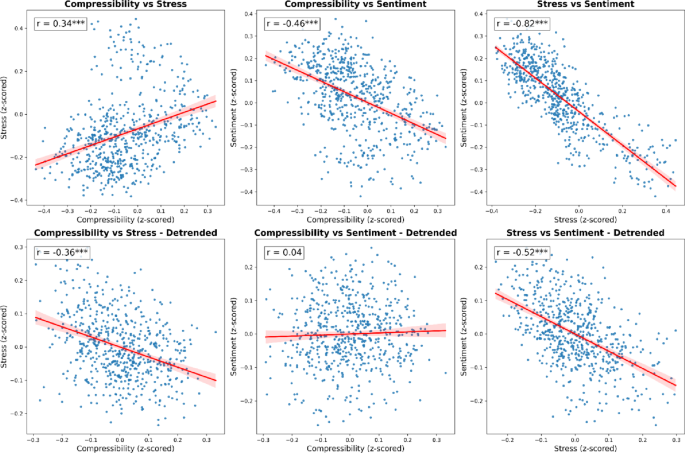
Statistics also includes visualizations: histograms, boxplots, scatterplots, bar charts, pie charts, etc.
1.3 Statistics is a rapidly changing field, but…
In the last two decades, statistics has evolved to focus on other applications and procedures. The change has been mostly driven by better computational tools (faster and easier to access) and an ever-increasing amount of data. Now, statistics is better known by other names: data science, machine learning, or artificial intelligence. These fields all rest on the same methodological foundations, combined with other fields, computer science in particular.
1.4 A worked example: Foramitti et al. (2025)
To fix ideas, let’s focus on one study: Foramitti et al. (2025) analyzed the sentiment of US Billboard songs from 1973 to 2023.
In the statistical parlance:
- Similarly, supporting H2a, the monthly average sentiment in popular music lyrics correlated negatively with time (r = −.78, 95% CI [−0.81, −0.75], p < .001).
- around the onset of COVID-19 in the US, the analysis yielded a lower adjusted R² of 0.475. Here, we found a small but significant interaction period × time (β = −0.007, 95% CI [−0.011, −0.003], t(49) = −3.626, p < 0.01) (Supplementary Table S5, Figure S3). However, this effect points in the opposite direction as hypothesized initially.
In plain English:
- Songs are sadder with time
- Songs are not always sadder after societal crises
1.5 Statistical analysis is a journey
From question → data → statistics → conclusions.
It requires complex technical tools, domain knowledge, and critical thinking.
The reward: a clear and adequate representation of the world which brings joy (or empowerment, an increase in ability, …).
1.6 References
Arndt, Stephan, Carolyn Turvey, and Nancy C. Andreasen. 1999.
“Correlating and Predicting Psychiatric Symptom Ratings: Spearmans
r Versus Kendalls Tau Correlation.” Journal of Psychiatric
Research 33 (2): 97–104. https://doi.org/https://doi.org/10.1016/S0022-3956(98)90046-2.
Breiman, Leo. 2001. “Statistical Modeling: The Two Cultures (with
Comments and a Rejoinder by the Author).” Statistical
Science 16 (3). https://doi.org/10.1214/ss/1009213726.
Chang, Chia-chen, Brenda B. Lin, Xiaoqi Feng, Erik Andersson, John
Gardner, and Thomas Astell-Burt. 2024. “A Lower Connection to
Nature Is Related to Lower Mental Health Benefits from Nature
Contact.” Scientific Reports 14 (1). https://doi.org/10.1038/s41598-024-56968-5.
Foramitti, Markus, Urs Markus Nater, Claus Lamm, and Maurício Martins.
2025. “Societal Crises Disrupt Long-Term Increases in Stress,
Negativity, and Simplicity in US Billboard Song Lyrics from 1973 to
2023.” Scientific Reports 15 (1). https://doi.org/10.1038/s41598-025-28327-5.
Galton, Francis. 1886. “Regression Towards Mediocrity in
Hereditary Stature.” The Journal of the Anthropological
Institute of Great Britain and Ireland 15: 246. https://doi.org/10.2307/2841583.
Galton, Francis. 1901. “132. The Possible Improvement of the Human
Breed Under the Existing Conditions of Law and Sentiment.”
Man 1: 161. https://doi.org/10.2307/2840363.
Kanaya, Yuta, and Nobuyuki Kawai. 2024. “Anger Is Eliminated with
the Disposal of a Paper Written Because of Provocation.”
Scientific Reports 14 (1). https://doi.org/10.1038/s41598-024-57916-z.
McDonnell, Amy S., and David L. Strayer. 2024. “Immersion in
Nature Enhances Neural Indices of Executive Attention.”
Scientific Reports 14 (1). https://doi.org/10.1038/s41598-024-52205-1.
Pearl, Judea, and Dana MacKenzie. 2017. The Book of Why. Basic
Civitas Books.
Stigler, Stephen M. 1989. “Francis Galton’s Account of the
Invention of Correlation.” Statistical Science 4 (2). https://doi.org/10.1214/ss/1177012580.